
 Felix Laurent
a16z says average token prices are down 67% since May, while token spend is up more than 120%. The firm posted the figures on X on Oct 31 under the line "Cheaper tokens don't mean cheaper bills". We read the newsletter behind the post and its chart, which show where each number comes from.
What a16z claims
The post makes two claims. Average token prices fell 67% since May, and token spend rose by more than 120%. The conclusion is that falling prices have not reduced what buyers pay. A day earlier, a16z posted a shorter window: since mid-July, average token prices were down 58%, while rental prices for Nvidia B300 GPUs rose 106%.
The arithmetic supports the direction. If prices fall to a third of their level and spend still more than doubles, volume must have grown by a large multiple. On the figures in the post, that implies roughly 6.7 times more tokens. On the higher spend estimate in the newsletter, it is closer to 7.9 times. Both are our calculations, not a16z's. The figures themselves come from three outside datasets.
Where the numbers come from
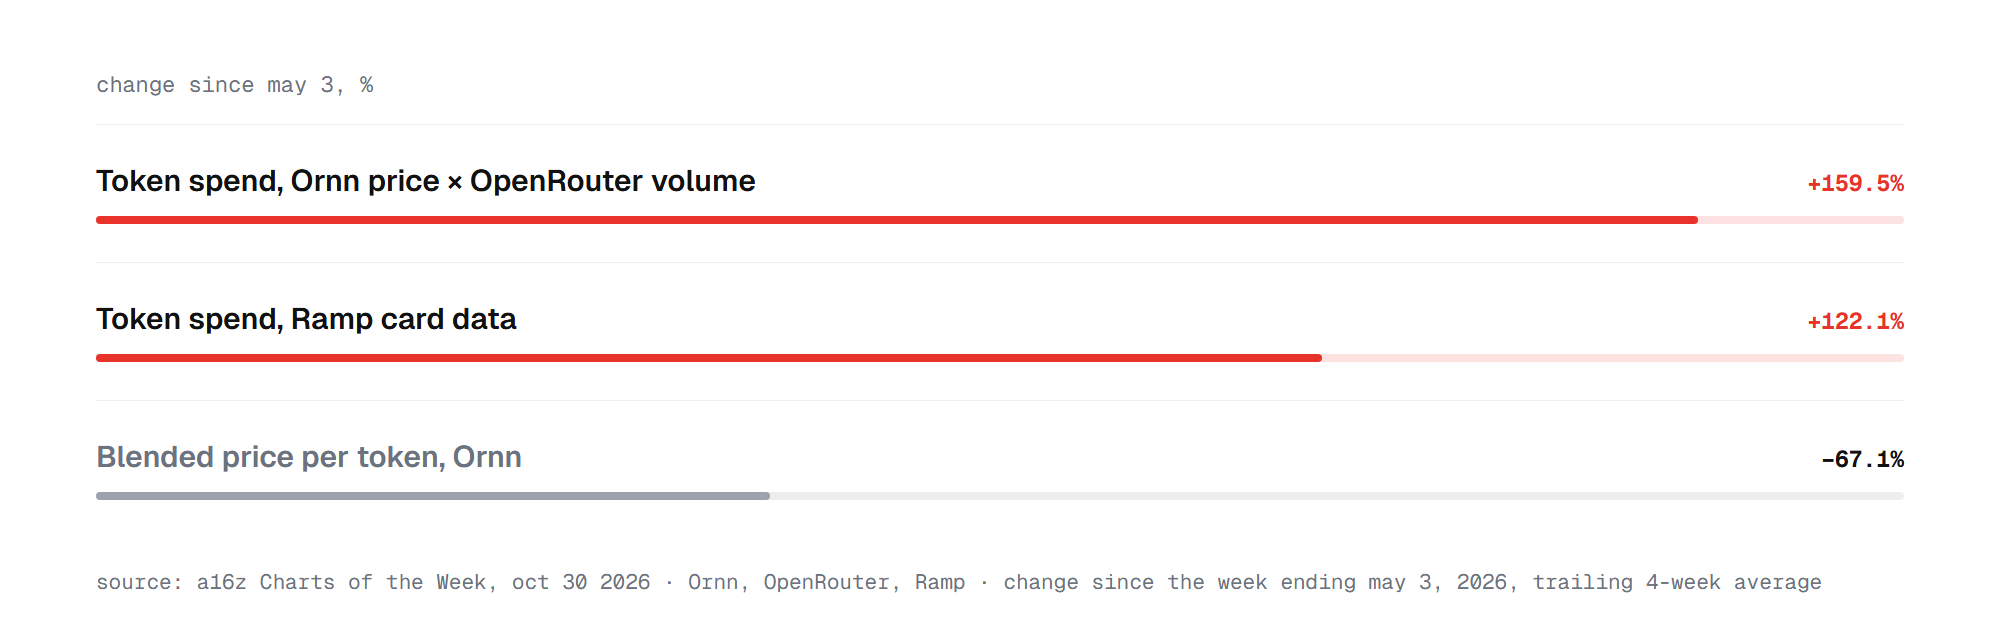
The post links to a16z's Charts of the Week newsletter from Oct 30, written by Moses Sternstein. Its chart, titled "How much is token spend increasing? It depends on who you ask", tracks the change since the week ending May 3, as a trailing four-week average.
The 67% is the blended price per token from Ornn, which falls 67.1% on the chart. Ornn publishes a token price index: a daily price of each lab's paid inference per million tokens, weighted by volume across its models. Ornn's site says it raised $33M in a round led by a16z.
For spend, the chart has two lines. Multiplying Ornn's price by OpenRouter's total token volume gives a rise of 159.5%. Ramp's data on company card spending on tokens gives 122.1%. The post's "more than 120%" uses the lower Ramp figure, and a16z's chart itself says the answer depends on who you ask.
The caveats a16z states itself
The newsletter calls its own method napkin math, not a rigorous methodology. It says the indexes come from small and biased samples that do not reflect ground truth demand for token volume or spend. It also says no one actually knows the totality of AI token spend. Taken at face value, it adds, the indexes still indicate that overall spending is increasing.
OpenRouter routes traffic mainly for developers and startups, and does not see what companies spend directly with OpenAI, Anthropic or Google. Ramp sees only its own customers' cards. Ornn's per-lab index also moves in different directions: in the month to Oct 30 it shows Anthropic's blended price down 44% and Google's up 3%. A fourth dataset points the same way.
What JPMorgan sees on OpenRouter
A retelling of a JPMorgan report from Oct 26, carried by KuCoin, uses OpenRouter data for October. It says usage rose 25% from September and 33 times from a year earlier. The weighted average price rose 12% in the month but fell 38% over the year. Total spending rose 40% in the month and 20 times over the year.
The report credits part of the October jump to Claude Opus 5.5, which added about 7.9 trillion tokens, and to price rises on some existing models. It warns that OpenRouter's sample leans toward developers, startups and coding agents. These figures use a different window, so they do not test a16z's since-May numbers. They point the same way on spend: prices down over the year, spending up far more.
An old pattern
a16z made the price half of this argument two years ago. In its November 2024 "LLMflation" post, Guido Appenzeller estimated that for a model of the same capability, the cost of inference falls about 10 times every year. Economists call the other half the Jevons paradox: when a resource gets cheaper to use, total use can grow so much that spending rises.
So do cheaper tokens mean cheaper AI bills? Not on any of the data here. Three datasets agree that spend is rising much faster than prices fall, whether the rise since May is 122% or 160%. But the exact figures are a16z's own napkin math from biased samples, and the 67% is a blended index across labs that move in different directions. The direction is clear. The size depends, as a16z's own chart says, on who you ask.
Sources
- a16z post on X, Oct 31 – the 67% and 120% claims
- a16z Charts of the Week, Oct 30 – chart, method and caveats
- Ornn token price index – per-lab blended prices
- KuCoin flash, retelling a JPMorgan report on OpenRouter – month and year figures
- a16z, LLMflation – background, Nov 2024